
 |
Original Research (Peer-reviewed)
Miller GY, Song Y, Bahnson PB. An economic model for estimating batch finishing system profitability with an application in estimating the impact of preventive measures for porcine respiratory disease complex. J Swine Health Prod. 2001;9(4):169-177. Also available as a PDF.
Objective: To develop a flexible economic model for estimating disease prevention profitability in batch swine finishing.
Methods: This spreadsheet model demonstrates relationships beyond basic production costs. Variation in weight gain drives variation in market weight and revenue. Mean weight and variation of weight, combined with the pricing matrix, drives revenue. User inputs may include costs, performance (feed conversion rate (FCR), mortality, ADG and its variability), and pricing matrix. The model calculates economic efficiency measures, and contrasts results for fixed time (DATE) and target market weight (WEIGHT) production systems. Default values are provided for all inputs, reflecting 1995 to 1998 US averages. Sensitivity analyses assess the influence of user-specified variables on profitability. The model estimates production improvements necessary to cover health intervention costs.
Results: Profitability is influenced by rate of gain and feed conversion; this relationship is strongest in the DATE system. Vaccine costing $1.00 per pig increased annual profits $3053 and $8007 per 1020-head barn, depending on the marketing focus and other assumptions. Also, to cover vaccination cost of $1.00, ADG must increase from 1.6887 to 1.7725 lb (WEIGHT) or 1.7100 lb (DATE ), or FCR must improve from 3.1200 to 3.0545 for either marketing strategy. Vaccination internal rate of return is 13.6 to 19.7% depending on the production system.
Implications: This model evaluates the economic impact of health interventions or production efficiency changes and can use farm-specific data. Understanding the economics of health interventions allows economically driven decision making by veterinarians and pig producers.
Keywords : swine, economic,
profitability, ADG, FCR
Received: June 13, 2000
Accepted: January 25, 2001
The importance of evaluating animal disease control programs on an economic basis has been recognized for many years. Economically rational decisions on disease control strategies at the producer level are based on an assessment of private costs and benefits. Economic evaluation of disease control programs for swine producers has often been approached by solving problems for individual producers and learning from the results in these producers' herds.1,2
Other approaches used are simulation of hypothetical herds3,4 and estimation of the economic impact of biological differences identified by studying specific alternative management strategies.5,6 These approaches are valid in specific circumstances.
The structure of the pork industry has changed dramatically during the last two decades.7 The industry is more concentrated, farms are larger, and coordination in the pork production chain is more organized. Large integrated operations often raise pigs under a batch production system. These operations often have identical barns and use the same genetic stock, feed, management plan, and disease control programs.
The pork industry has recently faced lower profit margins per pig, or negative profits with prices less than the marginal costs of production, and an inflexibility to easily exit the market. During such times, objective economic evaluation of management changes related to disease control becomes even more critical.
With the increased sophistication in the industry, approaches for evaluation increase in complexity. There is a need to evaluate the economic impact of disease and disease control from a systems perspective using system specific data.
Porcine respiratory disease complex (PRDC) continues to be a challenge for pork producers. Even though batch production practices were designed, in part, to help control PRDC,8,9 it continues to be a problem in batch production facilities.10,11 Disease in general, and PRDC in particular, can prevent swine farms from achieving economic viability. Porcine respiratory disease complex is an important influence on productivity measures such as rate of gain, feed efficiency, and days to market, which translate into economic measures for the farm and influence farm viability, especially over time.
Disease control costs must be measured against the benefits to be gained by implementing disease control programs. Thus, the objectives of this study were first to develop a model that can estimate the profitability of pig finishing in batch production systems using system-specific production data, and that can estimate the economic impact of disease control generally, and then to apply the model, using general data to reflect the economic impact of vaccinating against Mycoplasma hyopneumoniae in batch finishing systems.
This model was developed to run on an Excel12 spreadsheet, and uses an enterprise budgeting approach13 to evaluate the profitability (yearly return above total costs and yearly return above variable costs) of batch finishing pigs in a barn designed for 1020 feeder pigs. The model also estimates the economic impact of disease control in this production system. The spreadsheet runs on a pig live weight basis. If the producer has data only on carcass weights of pigs, a grid is shown for conversion to live weights. Important basic economic summary values are calculated, including total revenue per year, total costs per year, return above total costs, return above variable costs, and net present value.
The spreadsheet has the important advantage of allowing users to conduct sensitivity analyses and make calculations with user-specified data, for example, comparing yearly profitability when changes occur in feed conversion ratio (FCR), average daily gain (ADG), the standard deviation (SD) of ADG, and mortality rate over a range based on 10 to 90 percentile ranges for industry averages.14 A relative sensitivity analysis is conducted by graphing the percentage change in these four variables on a common horizontal axis.
Two types of marketing strategies are modeled: pigs shipped on the basis of achieving target weights (WEIGHT), or pigs shipped on pre-arranged shipment dates (DATE). The DATE marketing strategy is common in production systems with contracts.
The spreadsheet allows for user specification of the following at the batch level: basic characteristics of pigs placed in the finisher, including number, weight, and price of pigs; feed costs, including diet component prices and amounts of diet ingredients; growth of pigs, including pounds marketed, average length of the feeding period (to allow estimation of ADG by user), and number of days between batches for cleaning the facility, or user-specified ADG and FCR if these have already been calculated for the operation; marketing strategies, including number of pigs in each shipment, pig shipment schedule, number of shipments per batch, and target market weights; economic environment, including base price of market weight pigs, a pricing matrix that includes price differentials for carcass weight, and proportion of and prices for nonstandard market pigs; consideration of health effects on growth and thus revenue and costs, including mean weight of pigs that die and number of pigs that die per batch; and impact of vaccination and disease control on ADG, FCR, and cost of disease control. Additionally, the user can specify non-feed operating expenses and fixed costs for the year.
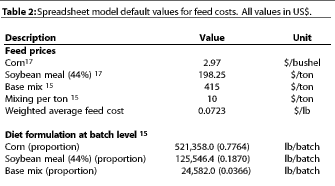
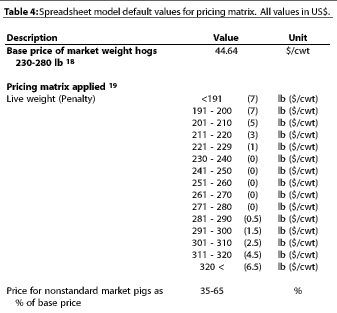
Default values for variables (Tables 1 to 4) are based on economic and production values in published literature (when available) for typical batch production facilities during 1995-1998. The SD of ADG represents the variability of ADG at the batch level, ie, a combination of the variability (sum of squares) within a shipment from a batch and the variability between shipments from a batch. The model assumes an SD of pig live weight marketed of 16.26 pounds; equivalently, 68% of the pigs marketed would weigh between 240 and 272 pounds.11
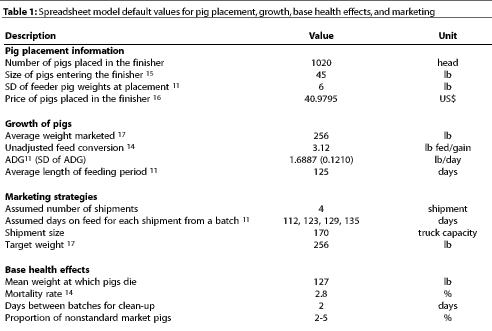
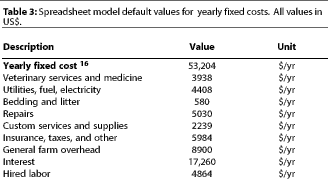
In our base model, we assume an unadjusted FCR of 3.12 (no adjustment made for deaths),14 and an adjusted FCR of 3.10 (adjustments made for deaths). We also assume that disease control programs for the barn cost $3938 per year and that this level of expenditure occurs with a mean ADG of 1.6887 pounds11 (SD=0.1210), and a mean mortality rate of 2.8%.14 Pigs are assumed to die at a mean weight of 127 pounds (personal communication, Y. Koketsu, May 1999 ).
If return above variable costs falls below zero, cash expended is larger than cash received. This is a situation that operations cannot long sustain. Variable costs included in the model are feeder pig purchase, feed, marketing, and disease control programs. All other costs at the barn level are considered fixed per year.
Data used for calculating the SD of ADG were those associated with a dissertation11 but were not reported in the dissertation per se. Two shipments (shipment 1 and 2) from each of 10 barns were tested for equal variance of carcass weights (F-test for equality of two variances).20 Because variances were found not to differ statistically (P>.10) for eight barns, carcass weight data from these eight barns were combined and a mean batch level variance in carcass weight was calculated. One of the remaining two barns had a small first shipment (fewer than 100 pigs) that preceded a much larger second shipment (more than 400 pigs) by a wide time interval (more than 3 weeks). These differences could cause the lack of equal variance for this barn, but shipments with this degree of size difference and time gap are not common for most batch production systems, so data from this barn was excluded. The tenth barn might have had a different variance by chance alone. Because carcass weights were available from these 10 barns, and the model runs on a live weight basis, carcass weights were divided by 0.74 to obtain estimated live weights. Estimated live weights were used to calculate a pooled mean, variance, and SD of live weight (SD = 16.26).
The model calculates the distribution (variation) in pig live weights marketed. We did not use data to measure the SD of ADG directly; very few production systems have individual pig weights at placement to match with individual pig or carcass weights at slaughter. Instead, we used an SD of ADG, and the SD of feeder pig weights, to estimate variation in live weights on the basis of variability observed in carcass weights. Most production systems have information on variability in either live weight or carcass weight at slaughter.
Two financial calculations that consider the time value of money are net present value (NPV) and internal rate of return (IRR). Net present value discounts projected revenues and costs to a common point in time, providing an estimated profitability that considers the interest that might be earned from alternative investment. The basic IRR is that interest rate which would result in an NPV of zero, or equivalently, the return received on the investment. The IRR for vaccination is defined as that interest rate which makes the NPV without vaccination (with default interest rate) equal to the NPV with vaccination, ie, the interest rate which reflects the economic return on vaccination cost. Our model projects into the future for 15 years (or approximately 38 to 40 batches, depending on marketing focus and associated assumptions) for the NPV calculations, with an assumed discount rate of 0.084725.21 Revenues are assumed to accrue at the time of shipment.
Feeder pig purchase costs are incurred at the time of pig placement, and marketing costs are incurred at the time of pig shipment. Other costs of production are assumed to occur daily at their average daily costs for the batch. This slightly overstates early batch costs and understates them later, when pigs eat larger amounts of feed. Nonetheless, this assumption is justified because, for large production systems, these costs even out over time, as multiple barns with pigs at different ages are being fed simultaneously.
The estimates for the economic impacts of vaccination for M hyopneumoniae are derived using the base model with default values and reflect our assumption that vaccination results in an ADG improvement of 0.0485 pound, an FCR improvement of 0.07, and a medication cost decrease of $0.48883 per pig.6 Vaccine costs were assumed to be $1.00 per pig.
We assume that ADG of pigs placed in a batch is normally distributed. We assume also that the probability density function of ADG describes pig growth. Pig growth (weight as a function of time) is represented as a weighted average ADG for each shipment of pigs (reflected by different slopes in the pig growth functions), assuming a constant coefficient of variation. These growth curves determine the time and weight of different marketing groups. For example, the time needed to reach a specific weight using WEIGHT marketing, and the weight achieved after a specific amount of time using DATE marketing, are derived using these curves. Average daily gain and the variability in ADG are the main driving forces determining revenues received.
A key assumption for DATE is the time when each shipment is assumed to occur. In the base model, pigs are slaughtered 112, 123, 129, and 135 days after batch placement in the finisher.11 The assumed days on feed at the time of first shipment (default of 112 days) was chosen to provide a shipment schedule with approximately the same mean number of days on feed for WEIGHT (125.53 days) or DATE (125.17 days). This allows for a sensitivity analysis that varies production parameters such as ADG.
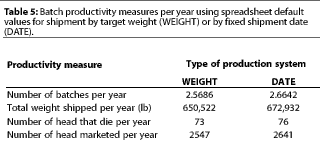 Production measures that drive
the economic calculations, such as number of batches per year
and total weight shipped per year, show that there is a slight
advantage on weight shipped per year from DATE under the default
values (Table 5). This occurs because the number of batches shipped
per year is slightly higher for DATE compared to WEIGHT. Thus,
despite the slightly lighter average weight in the last shipment
from the barn under DATE (248 pounds) compared to WEIGHT (256
pounds), pounds shipped per year under the DATE marketing strategy
are higher.
Total annualized revenue from the sale of market hogs is $286,415 per 1020-head finishing barn for WEIGHT, or $294,880 for DATE (Table 6). Total costs each year are $283,436 for WEIGHT, with an annual return above total costs of $2980, or $290,706 for DATE, with an annual return above total costs of $4174. The break-even, live weight price to cover total costs of production is $43.57 per hundredweight for WEIGHT or $43.20 per hundredweight for DATE.
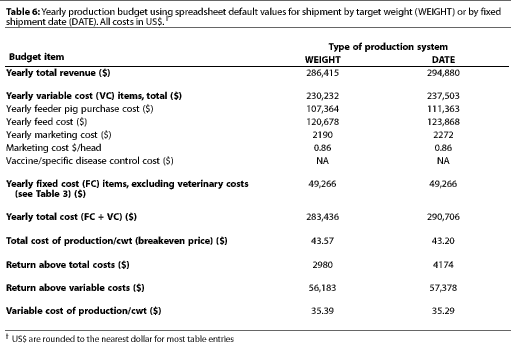
Return above variable costs each year is $56,183 (WEIGHT) or $57,378 (DATE). The market hog price to cover variable costs of production is thus $35.39 per hundredweight (WEIGHT) or $35.29 per hundredweight (DATE).
Net present value, using 15-year projections into the future, is -$7109 for WEIGHT, or $1714 for DATE. The internal rate of return is 7.19% (WEIGHT) or 8.76% (DATE).
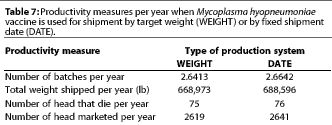 Productivity measures are improved
with vaccination (Table 7) compared to no vaccination. The number
of batches shipped increases to 2.64 for WEIGHT, but, of course,
remains fixed at 2.66 for DATE. Total weight shipped per batch
is higher under both marketing strategies when vaccination is
used. Although the assumed mortality rate remains the same, the
number of head that die increases slightly because more batches
are placed in a year.
Total revenue received each year from the sale of market hogs from the 1020-head finishing barn (Table 8) is $294,522 for WEIGHT or $301,411 for DATE. Total costs each year are $288,489 for WEIGHT, giving a return above total costs of $6033, or $289,230 for DATE, giving a return above total costs of $12,181, for an improved annual profitability, with the use of M hyopneumoniae vaccination, of $3053 (WEIGHT) or $8007 (DATE). Revenues in excess of variable costs each year are higher when vaccination is used; thus, vaccination allows for additional revenue to cover a larger portion of fixed costs, even if the economic environment is such that profits are lower or negative (for example, when the price of pigs falls). Of course, all calculations depend directly on the assumptions about the impact of vaccination on productivity.6 If FCR improves, or ADG is higher than assumed, then the impact on profitability would be even greater.
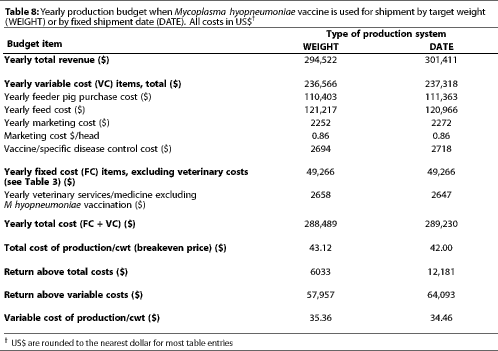
With vaccination, NPV for a 15-year projection into the future is $19,309 (WEIGHT) or $70,308 (DATE). The IRR for vaccination is 13.6% (WEIGHT) or 19.7% (DATE).
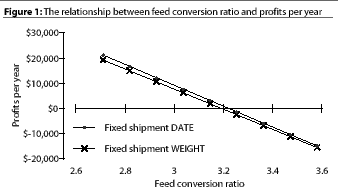 Sensitivity analyses are presented
on a cash basis, rather than on a discounted basis. Profitability
is very sensitive to changes in FCR (Figure 1). Feed costs represent
a high percentage of production costs; thus, small changes in
FCR produce dramatic changes in profitability. When other default
values are constant, changing FCR from 2.71 (90th percentile)
to 3.58 (10th percentile) changes estimated annual
profits from $19,368 to -$15,407 for WEIGHT or from
$21,173 to -$14,898 for DATE.
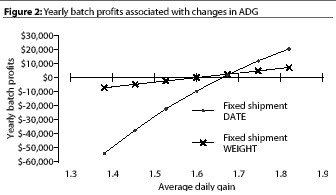 Profitability is also sensitive
to changes in ADG (Figure 2). Severe disease outbreaks may markedly
slow growth. The two marketing strategies may have a major influence
on profitability from a batch when this happens. If the
marketing strategy is flexible (WEIGHT), pigs are still able to
achieve their target market weight, but low ADG reduces profitability.
However, the reduction in profitability is much greater when the
producer is locked into specific pig marketing dates (DATE) and
is unable to adjust to the poor gain in a particular batch. Fixed
shipment date marketing is more sensitive to changes in ADG: if
pigs are marketed at low weights, major price penalties are incurred.
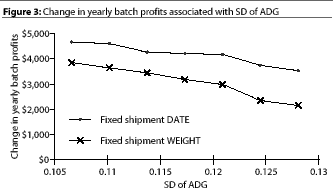 Sensitivity analysis shows that
SD of ADG is an important influence on profitability (Figure 3).
However, SD of ADG clearly doesn't produce the same fluctuations
in profits as do small changes in ADG or FCR. The SD of ADG can
increase to approximately 0.151 under WEIGHT and to more than
0.177 under DATE before annual profits become negative. Both of
these values are substantially higher than the default value of
0.121.
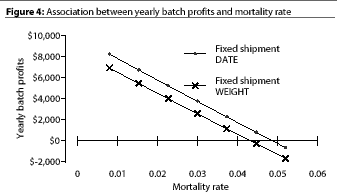
Mortality rate influences profitability (Figure 4), but not as much as ADG and FCR. Batch annual profitability becomes negative when the mortality rate is higher than 4.3% for WEIGHT or 4.9% for DATE.
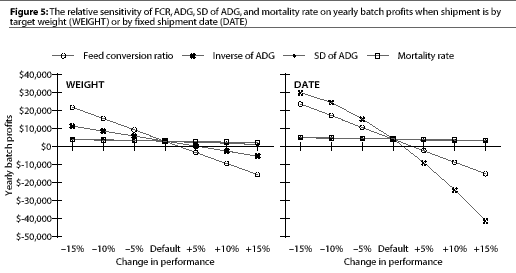
Comparing the relative sensitivity of ADG, SD of ADG, FCR, and mortality rate on profitability (Figure 5) demonstrates that yearly profit of DATE is relatively more sensitive to changes in ADG and FCR than is yearly profit of WEIGHT. Also, the steeper slopes of the curves for FCR and ADG show that these are more important variables influencing profitability than SD of ADG and mortality rate (slopes of these curves are flatter).
A marginal analysis for vaccination can be expressed in terms of needed improvements in any of the productivity measures to cover vaccination costs of $1.00 per head. Considered alone, ADG must improve to approximately 1.7725 (WEIGHT) or 1.7100 (DATE) to cover vaccination costs. Also considered alone, FCR must improve to approximately 3.0545 (WEIGHT and DATE) to cover a disease control cost of $1.00 per head. These numbers are influenced by and dependent on all other default values and assumptions in the model.
This model, while complex in its analytical capabilities and computing powers through sensitivity analyses, is still a relatively static approach. It is neither a fully dynamic model nor an optimization model. An optimization model might allow quantitative control of input variables that could be adjusted to optimize profits, while our model assumes input levels and their relationship to associated profits. A fully dynamic model might adjust the time pigs are held in the finisher in the DATE marketing strategy on the basis of the number of days that would optimize profits, while our model assumes a fixed number of days to marketing. The approach used in our model demonstrates how changes in production parameters (eg, ADG or FCR) might influence annual profits if marketing decisions are not adjusted in response to those changes.
For the model to be even more accurate and useful, the relationships between production parameters (eg, ADG and FCR) and marketing decisions at the systems level would need to be incorporated in a dynamic approach to growth and production. This is a complex problem, and the data needed to generate these relationships are not readily available in many production systems. The assumption of four linear growth functions may not adequately describe the growth of pigs near slaughter weight, where ADG often begins to slow. For more accurate modeling of pig growth near market weight, data would be needed on weights of pigs close to market weights over a period of time to generate system specific functions. However, description of pig growth near market weight is difficult, since this is the very time when pigs are most difficult to weigh. Thus, these data are not available for many production systems.
Several studies have presented evidence that growth may be curvilinear over the finishing period at commercial stocking densities.22-26 These studies demonstrate the large number of complexities that can be modeled as we learn more about the intricate interrelationships involved in pig growth. Andersen and Pedersen model gain as a quartic function of days22 from an experiment using Hampshire, Duroc, Landrace, and Yorkshire crossbred castrated males and gilts on test from 30 to 115 kg (66 to 254 lb) live weight. Despite estimating a quartic function, they state that "it is obvious that growth is almost linear as a function of days on test." We assume a linear growth function as a reasonable first order approximation, recognizing that this assumption may limit the usefulness and ultimate accuracy of the model, especially in production systems that employ genetic lines with smaller mature body size or that sell pigs at very heavy weights.
Very light animals are commonly marketed separately to smaller packers-processors because major packers-processors heavily discount prices in these weight categories. However, no standard mechanism exists for marketing light weight pigs in batch production systems. Proportion of light weight pigs is assumed to be 2 to 5%, and the price for light weight pigs is assumed to be 35 to 65% of base price (personal communication, L. Parkes, February 2000). Some farms may not market light weight pigs to a different packer than their standard pigs, or they might not have the proportion of light weight pigs assumed, or they might receive a different price than assumed.
Profitability estimates apply to batch-style production systems. Results obtained using our model may not be appropriate for other types of production systems.
Incorporation of model changes as the model is reviewed and used by production system managers and swine veterinarians will be important. The model might be useful to more farms if it allowed for different types of pig diets (eg, phase feeding), as long as the model also then calculated costs and the dynamics of pig growth in relation to the diets. The model currently does not have this capacity. Also, the model does not handle multiple pricing grids from different packers. We envision model enhancements as an ongoing process. Revisions in diet, pricing grid, and producer review are currently underway as part of a follow-up study.
It is important to note that this model uses fundamental economic principles, deductive reasoning, and an enterprise budgeting approach. The model cannot be validated using empirical producer economic data because there are too many uncontrolled variables in production situations. The strength of our approach is that it allows isolation of the effects of specific production practices (eg, vaccination) and the influence of these production practices on farm profitability while holding constant the variables that are not influenced by these practices. This type of information is valuable in practical situations when producers must make decisions about disease prevention.
Our model generates the profitability from controlling PRDC
by vaccinating for
M hyopneumoniae. However, the assumed productivity effects
of vaccination are potentially very specific to particular producers.
The influence of vaccination on productivity in the US might be
different from the European study.6 Conducting trials
within particular production companies may be warranted to gain
information about the changes in productivity from vaccination
within the company. User-specified productivity measures, used
in combination with our model, will give the model user a higher
degree of confidence that the estimated economic impact is accurate.
Despite the limitations of our model, the hypothetical herd is well simulated, and its strong capacity for sensitivity analyses of various types differentiates it from other, simpler budget spreadsheets. Most interesting are the relative slopes comparing FCR, ADG, SD of ADG, and mortality rate (Figure 5) to annual profitability. This sensitivity analysis demonstrates that changes in production practices that result in changed FCR or ADG have the potential for a much greater impact on profitability than changes in SD of ADG or mortality rate. We chose to use the 10 to 90 percentile ranges of variables for sensitivity analyses (Figures 1 to 4) and also the relative comparison of these variables (Figure 5). However, we realize that mortality rate may vary substantially more than this, at least at the barn level. Allowing a larger percentage change in mortality rate would, of course, make this variable appear relatively more important.
Lower variability in ADG implies more similar pig weights and performance and results in higher revenue because more pigs are located inside the highest price portion of the pricing grid. However, considered alone, the variability in ADG appears less important in driving revenues than changes in ADG itself.
It is important for users of this model to have a firm understanding of the variability of ADG if they are to use their own estimate of this variable. A reasonable estimate could be obtained by examining slaughter records from representative barns to obtain weight data and adjusting for days on feed and conversion to live weights if necessary. Knowing a system-specific estimate of live weight variability, the model user can then, by repeated trials with different values of SD of ADG, determine the SD of ADG which will provide this live weight variability. The assumed SD of ADG (0.1210) combined with the variability of feeder pig placement weights (SD = 6) results in an SD of live weights of 16.26 pounds. Previous data11 suggested this was a reasonable SD on pig market live weight. It is important to conduct sensitivity analysis on SD of ADG because the estimated variation (SD) in ADG is not well documented in the literature or in production system records, and because of the industry focus on producing uniform pigs.
Marginal analysis, reflecting the amount of productivity gain needed to pay for $1.00 of disease control, is presented. However, such marginal analyses depend on default values and assumptions, particularly the price of pigs and important production inputs such as feed costs.
Many production systems attempt to fully utilize facility space while simultaneously using practices (eg, age-segregated rearing) known to help control diseases, and thus operate under the DATE marketing system. If gain is sufficiently higher in DATE systems, profitability may be correspondingly higher, even though DATE is more sensitive to decreases in rate of gain than is WEIGHT. Some DATE systems extend the growing period without breaking pig-flow or all-out production practices for the majority of pigs produced and the majority of their barns. They extend the growing period by shipping underweight pigs to "clean-up facilities" for further growth. The contrast in profitability between the two marketing strategies may reflect improper scheduling in DATE. This has been studied in more detail.27
The economic impact of vaccination differs between the two marketing strategies. Using the default values in the base model and no vaccination, the profits are similar whether pigs are reared in DATE or WEIGHT production systems. As ADG increases above the default values, as expected with successful disease prevention, we see a divergence in the profitabilities of the two marketing strategies. A combination of factors is responsible for this divergence. First, there is no adjustment in the number of days pigs are held in DATE. Second, the average weight of pigs assumed (256 pounds) is less than the weight at which pigs begin to receive price penalties because of size. Finally, growth is assumed to be linear through this weight range.
This model may be applied to other disease control strategy assessments and other management changes. The model28 works equally well for data related to other diseases or management strategies as long as these data focus primarily on productivity gains and the cost of disease control can be estimated. This is generally the case in batch production systems where records focus on productivity measures, and items related to general disease control are already in place (eg, high biosecurity).
We chose to keep the sensitivity analyses on a cash basis because it allows for better assessment of the way the model works and because most producers and veterinarians think about cash flows rather than NPV. However, yearly profitability and NPV are not completely parallel calculations and may become positive at different productivity values. Thus, using both yearly profits and NPV would enhance decision making.
The NPV will always be negative when the IRR is less than the assumed discount rate, in this case, less than 8.47%. Equivalently, the IRR will always be less than the assumed discount rate when the NPV is negative. It simply means that the rate of return in swine production is less than might be achieved in alternative investments.
Funded in part by a grant from the Illinois Council for Food and Agricultural Research (C-FAR).
1. Parsons TD, Pitcher PM, Johnstone C. Economic analysis of an epizootic of pseudorabies and subsequent production following the institution of a vaccination program in a Pennsylvania swine herd. JAVMA. 1990;197:188-191.
2. Bech-Nielsen S, Miller GY, Bowman GL, Dodaro SJ. Economic impact of an epizootic of pseudorabies in a commercial swine herd in Ohio, achieving test negative status and quarantine release by use of vaccination and test and removal. JAVMA. 1992;200:1817-1823.
3. Miller GY, Forster DL, Tsai J, Bowman G. Productivity and profitability differences between pseudorabies infected and non-infected farrow-to-finish swine herds. JAVMA. 1995;206:446-451.
4. Rodrigues CA, Gardner IA, Carpenter TE. Financial analysis of pseudorabies control and eradication in swine. JAVMA. 1990;197:1316-1323.
5. Morrow MWE, Leman AD, Marsh WE, Williamson NB. An economic study of lifetime piglet production for sows allocated to treatments designed to improve parity two litter size. Prev Vet Med. 1990;10:105-118.
6. Maes D, Deluyker H, Verdonck M, Castryck F,
Miry C, Vrijens B, Verbeke W, Viaene J, de Kruif A. Effect of vaccination against Mycoplasma hyopneumoniae in pig herds with an all-in/all-out production system. Vaccine. 1999;17:1024-1034.
7. Rhodes VJ. The industrialization of hog production. Rev Ag Econ. 1995;17:107-118.
8. Clark LK, Scheidt AB, Armstrong CH, Knox,K, Mayrose VB. The effect of all-in/all-out management on pigs from a herd with enzootic pneumonia. Vet Med. 1991; 946-951.
9. Scheidt AB, Cline TR, Clark LK, Mayrose VB, Van Alstine WG, Diekman MA, Singleton WL. The effect of all-in-all-out growing-finishing on the health of pigs. Swine Health Prod. 1995; 3:202-205.
10. Thacker EL, Thacker BJ, Boettcher TB, Jayappa J. Comparison of antibody production, lymphocyte stimulation, and protection induced by four com-mercial Mycoplasma hyopneumoniae bacterins. Swine Health Prod. 1998;6:107-112.
13. Calkins PH, DiPietre DD. Farm Business Management: Successful Decisions in a Changing Environment. New York: Macmillan Publishing Co Ltd; 1983:77-182.
16. Economic Research Service, USDA. US feeder pig-to-finish production cash costs and returns, 1992-98. Available at http://www.ers.usda.gov/data/costsand returns/car/hogs3.htm. Accessed May 1, 2001.
17. National Agricultural Statistics Service, USDA. USDA-NASS Agricultural Statistics 1999. Available at http://www.usda.gov/nass/pubs/agr99/acro99.htm. Accessed May 1, 2001.
18. Economic Research Service, USDA. Livestock, Meat and Wool Weekly Summary and Statistics. Available at http://usda.mannlib. cornell.edu/data-sets/livestock/. Accessed May 1, 2001.
19. Farmland. Farmland Pricing Report. Available at http://www.nppc.org/price reporting/farmland.html. Accessed May 1, 2001.
20. Rosner B. Fundamentals of Biostatistics. Boston, MA: PWS-Kent Publishing Co; 1990:265-268.
22. Andersen S, Pedersen B. Growth and food intake curves for group-housed gilts and castrated male pigs. Anim Sci. 1996; 63:457-464.
23. Smith JW, Tokach MD, Schnickel AP, Dritz SS, Einstein M, Nelssen JL, Goodband RD. Developing farm-specific lysine requirements using accretion curves: Data collection procedures and techniques. Swine Health Prod. 1999;7:277-282.
24. Brumm MC, Dahlquist JM, Heemstra JM. Impact of feeders and drinker devices on pig performance, water use, and manure volume. J Swine Health Prod. 2000;8:51-57.
25. Schinckel AP, de Lange DFM. Characterization of growth parameters needed as inputs for pig growth models. J Anim Sci. 1996;74:2021-2036.
26. Brumm MC, Miller PS. Response of pigs to space allocation and diets varying in nutrient density. J Anim Sci. 1996;74:2730-2737.
11. Bahnson PB. Enzootic Pneumonia of Swine: Epidemiology and Effect on the Rate of Gain [PhD thesis]. St Paul, MN: University of Minnesota: 1994.
12. Microsoft Excel, Microsoft Corporation, Redmond, WA 98052-6399
14. Pig CHAMP. Pig CHAMP DataSHARE, 1998 Summary Report, 1998; 1999.
15. Schnitkey G. Hog Farm Management Handbook. Urbana-Champaign: University of Illinois; 1999.
21. The Federal Reserve Board. The Federal Reserve, Research and Data; Statistics: Releases and Historical Data; Selected Interest Rates; Bank Prime Loan. Available at http://www.federal reserve.gov/releases/H15/data/a/prime.txt. Accessed May 1, 2001.
27. Song Y, Miller GY. Marketing strategies to improve profitability in hog finishing operations. Rev Agr Econ. In press.
28. http://www.cvm.uiuc.edu/pigpneumonia/pneumonia_front_page.html. At this website, additional details of the spreadsheet model can be found. The spreadsheet can be downloaded at this URL.
 |


The AASV website and The Journal of Swine Health and Production are made possible by the generous support of the AASV Industry Support Council, including: .
Copyright (C) 1996-2002 American Association of Swine Veterinarians. Please send your suggestions about this site to Dave Brown, webmaster@aasv.org.
This page last updated April 19, 2012.