Practice tip
Non refereed
Charting influenza titers
John Roberts, DVM, PhD
College of Veterinary Medicine, North Carolina State University, Raleigh, North Carolina.
Roberts J. Charting influenza titers. J Swine Health Prod. 2002;10(1):39-40.
Swine influenza virus (SIV) receives attention as a respiratory pathogen. Serologic studies are often used to assess the age at which SIV infections are the most active in nursery and finishing pigs. Samples are collected to represent pigs of several different ages. Samples may be drawn from the same pigs as they age or from many pigs across a range of ages. Regardless of how the sampling frame is or-ganized, the essential task is to interpret test results in a manner that produces accurate information.
Veterinarians interpret the data, hoping to determine the age at which most pigs seroconvert. A common interpretative approach is to plot on a bar or line graph the seroprevalence of SIV in each sampled age group. A similar plot is made of the average serologic responses for each age group. Age of seroconversion is detected on the plots by identifying the week of age that test results signal a spiking prevalence or average. However, finding a signal is subjective and easily biased. Influenza is endemic in most swine herds, and seroconversion may be obscured by maternal immunity and low-intensity exposure. The age at which animals seroconvert may not be readily identifiable. Statistical methods can assist interpretation of the data to help clarify this.
Seroprevalence
Seroprevalence is the proportion of sero-positive animals in a sampled age category. Seropositivity depends on the definition of a "positive cut-point." A cut-point is a benchmark more than a standard and may be manipulated. For example, if an individual sample tested by hemagglutination inhibition (HI) for SIV strain H1N1 has a reciprocal titer of 20, does this indicate a positive test? It is commonly identified as "suspect". To determine seroprevalence in an age category, it is best to increase the cut-point to 40, although it may be argued that this is not high enough. During acute challenge with SIV, pigs develop titers that increase exponentially. When a positive result is defined by higher cut-points of 80, 160, or 320, only the most acutely infected animals are included in the calculation of seroprevalence. Traditional cut-points are starting points: varying the cut-point may help to interpret the data.
You can see the results of changing a cut-point by noting the effect on the age-separated seroprevalence plot. It is easy to assign a spreadsheet cell to contain the cut-point value. The HI titers for each age group are digitally interpreted as positive or negative on the basis of the value in the cut-point cell. Changing the content of the cut-point cell automatically revises the plot and yields a visual sensitivity analysis of increased or decreased cut-points. Changing the plot by altering cut-point values allows one to interpret from several plots and select the best supported description of the age when pigs seroconvert. This is analogous to changing the fine focus on a microscope.
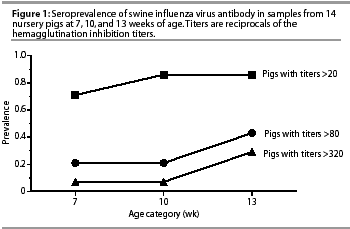
In Figure 1, the same data has been interpreted using three different cut-points to produce three plots of SIV seroprevalence in pigs of differing ages. When the data is plotted using two cut-points that are higher than the accepted benchmark of >=40, the identifiable age of seroconversion is 3 weeks later. The later point of seroconversion may be more credible, as the sensitivity of the interpretation is increased to include only the most obviously acute pigs in the calculation of seropreva-lence by age.

Seroprevalence is easily calculated in Excel (Microsoft, Redmond,
Washington) using two steps. In the first step, the cut-point
cell converts test values into the dummy variables "0"
and "1." Each test value is converted to a zero or a
one using the "=IF" function: the function is "=IF(Test
Value Cell>Cut Point Cell,1,0)". Sample values greater
than the cut-point return a "1", and values equal to
or less than the cut-point cell value return a "0".
The seroprevalence of SIV is calculated in one cell from the list
of dummy variables for each age category. The entry for the seroprevalence
cell is "=SUM(Xi...Xz)
/COUNT(Xi...Xz), with "Xi...Xz" representing the categorical
list of dummy variables.
Average SIV titers
The average SIV titer for an age category provides information about the intensity of seroconversion in a group. Calculation of serologic averages may be biased by the method of determining HI titers.
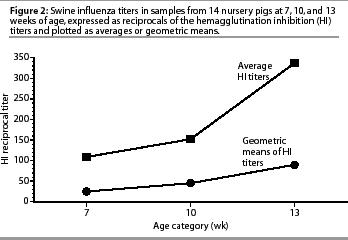
Some serologic determinations report test data from a scale of continuous or discrete linear values. The linear scales increase in an additive fashion. The PRRS ELISA scale is continuous, but can serve as an example: 0.5, 1.0, 1.5, 2.0, 2.5, 3.0 (successive values increase by 0.5). Influenza HI test results are reported as discrete reciprocals of doubling dilutions. The increase is not additive, but multiplicative. The swine influenza HI scale is geometric: 20, 40, 80, 160, 320, 640 (successive values increase by a factor of 2). The geometric scale is logarithmic. It is best to express an average influenza HI titer as a geometric mean. A geometric mean is calculated by averaging the logarithms of the test values and then converting the mean to a real number. This prevents a few obviously high positive values from making the mean unrealistically large. Comparisons of results are clearer when more than one acute sample is required to intensify the average of an age category. The same data used for age seroprevalence plotting is presented to compare mean determinations across age. The plot of age categories in Figure 2 shows an intense conversion after week 10 when average titers are plotted. When the geometric means of the same titers are plotted, the graph shows that titers actually increased slowly in pigs 7 to 13 weeks of age and does not indicate a specific age of acute intensity.

The function for a geometric mean in Excel is "=GEOMEAN(Xi...Xz)", with "Xi...Xz" representing a list of categorical sample values. Reported titer values of "0" must be placed in the spreadsheet as "1", as the logarithm of zero does not exist and returns an error as "#NUM!".
Organizing and conducting serologic studies represents a lot of effort. Remember that positive cut-point values are not "set in stone." Also, take precautions to avoid information that can render statistics inaccurate due to a nonlinear reporting scale. Paying attention to these issues will insure that study efforts return factual information.
