Production tool |
Peer reviewed |
Financial impact of average parity of culled females in a breed-to-wean swine operation using replacement gilt net present value analysis
Kenneth J. Stalder, MS, PhD; R. Curt Lacy, MS, PhD; Timothy L. Cross, MS, PhD; Glenn E. Conatser, MS
KJS, GEC: Department of Animal Science, The University of Tennessee, Knoxville, TN 37901-1071. RCL: Agricultural and Applied Economics, University of Georgia, Tifton, GA 31793-0748. TLC: Agricultural Economics and Resource Development, The University of Tennessee, Knoxville, TN 37901-1071. Corresponding author: Dr K.J. Stalder, West Tennessee Experiment Station, 605 Airways Boulevard, Jackson, TN 38301; Tel: 731-425-4705; Fax: 731-425-4720; E-mail:stalder@utk.edu.
Stalder KJ, Lacy C, Cross TL, et al. Financial impact of average parity of culled females in a breed-to-wean swine operation using replacement gilt net present value analysis. J Swine Health Prod. 2003;11(2):69-74.Also available as a PDF
Summary
A net present value (NPV) analysis was used to determine the number of parities a sow must remain in the breeding herd of a breed-to-wean operation before the initial investment in her is profitable, and to evaluate the sensitivity of NPV to production, price received, and gilt replacement price. On the basis of 1996-2000 average production levels, segregated early weaning (SEW) pig price, production costs, and equity information, a replacement gilt must remain in the breeding herd for three parities before reaching a positive NPV. Sows having a longer productive herd life, when SEW price is at profitable levels, produce a higher NPV, and thus are more profitable investments than females which remain in the herd for shorter periods of time.
Producers should identify genetic and environmental factors that improve the productive life, and thereby the NPV, of their replacement gilts. Additionally, increasing SEW pig prices and productivity improve the parity in which a replacement gilt reaches a positive NPV. This type of analysis could be used to assist producers, practitioners, extension specialists, consultants, and others to evaluate a host of management tools designed to improve the parity structure of commercial swine breeding herds experiencing the challenges of excessive culling.
Keywords: swine, net present value, gilt replacement, sow longevity, culling
Received: May 2, 2002
Accepted: July 29, 2002
From 1996 through 2000, PigCHAMP (Swine Data Manage-ment, Wheatland, Iowa) reported that the replacement rate (culling plus sow mortality) of breeding herd females in US commercial swine herds has averaged near 50%.1-5 Combined high voluntary and involuntary culling rates result in the purchase of more breeding gilts. These purchases increase the capital requirements for the operation, and combined with associated increase in gilt development and acclimation expense, adversely affect profitability.
The National Swine Improvement Federation (NSIF) suggests that parities four and five are mature equivalent,6 ie, are the parities where no adjustment is necessary (for example, number born alive record receives no adjustment for parity of sow). Published recommendations for ideal parity distribution of the sow herd include 15% first parity sows, 14% second parity sows, and 13% third parity sows.7 Hence, a substantial portion of the sow herd is producing below mature equivalent parities. These distributions result in a weighted average parity of breeding females of 3.85 in a swine herd. Reported average herd parity of culled sows ranges from 3.1 to 3.7.1-5 A sow remaining in the breeding herd for fewer parities is likely to produce fewer pigs in her lifetime, compared to a sow that remains in the breeding herd for a longer period of time. This reduces the opportunity of a sow to be sufficiently productive (pigs weaned and sold per lifetime) to achieve a profit from the investment.
The purposes of this study were to determine the number of parities a sow must remain in the breeding herd of a breed-to-wean operation before a positive net present value (NPV) is reached, on the basis of historical feed costs, market hog price, gilt replacement cost, and current herd productivity averages reported by commercial record-keeping services; and to evaluate the sensitivity of NPV to production (number of pigs born alive), price received (SEW pig price), and gilt replacement price.
Materials and methods
Production data
Production data, including number of pigs born alive per litter, pre-weaning death loss, breeding herd mortality, litters per sow per year, and average parity of sows farrowing, were based on 1996-2000 PigCHAMP reports from a commercial swine record-keeping service.1-5
Value of animals
Weight and price received (adjusted for mandatory checkoff applied during this time period) per 100 kg for cull sows sold was a 5-year US average of prices and weights in the USDA US Slaughter Sow Report (Louis Langell, United States Department of Agriculture Market News Service, written communication, 2001). The value of cull sows was adjusted to reflect the reduced number of saleable cull sows due to breeding herd mortality. The price received for SEW pigs was assumed to be $32 and was chosen to provide a reasonable mid-point for conducting sensitivity analyses. All values and prices referred to in this study are in $US.
Model operation
It was assumed that the enterprise modeled was a 600-sow breed-to-wean operation. This facility was assumed to be a totally confined crated gestation and farrowing facility that utilized a pull-plug-lagoon waste management system. This herd size was based on the average female inventory reported by the commercial record-keeping service from which production values were obtained. The investment required for a 600-sow farrow-to-wean operation was obtained from a University of Tennessee budget.8 The analysis assumed that the owner had 50% equity in the swine facilities. Debt was financed at a 9% annual interest rate, reflecting the approximate annual average cost of borrowed capital during the 1996-2000 time span evaluated in this study.9
Replacement gilt expenses
The price paid for replacement gilts was calculated as the value of a market pig at the same weight plus a $90 genetic premium. Hence, the 5-year average price per kg for a market hog10 was multiplied by the average weight (117 kg) of market hogs,11 resulting in an average market value of $110 per market gilt. The $90 genetic premium was added to market value when deriving the $200 replacement gilt cost. Each gilt was assumed to remain in an isolation and acclimation facility for 60 days. It was also assumed that 90% of the gilts purchased entered the breeding herd.
Variable expenses
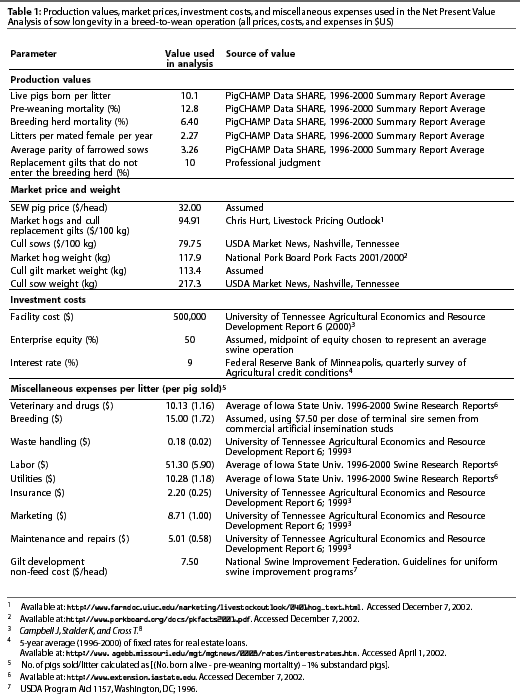
Variable expenses were based on values obtained from the 1996-1999 Iowa State University Swine Business Record Breed-to-Wean Summary12-15 and University of Tennessee budgets.8 As the Iowa State University Swine Business Records were discontinued, a 2000 yearly summary was not available. The production values, market prices, investment, and miscellaneous costs are shown in Table 1.
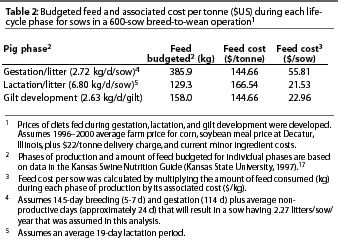
Feed prices were calculated using 5-year average corn and soybean meal price obtained from the USDA.16 An additional $22 per metric ton was added to the soybean meal price for delivery charges. The corn and soybean prices were used to calculate costs for rations fed to gestation and lactation females. Diets priced and used in this analysis were based on The Kansas Swine Nutrition Guide17 for feeding a high-lean, productive sow.
Analysis
Capital budgeting. In economic terms, a swine producer faces a capital budgeting decision when the purchase of breeding herd replacement females (or any other depreciable asset) is considered. When capital budgeting for a breeding-herd replacement gilt, the number of periods (parities) that a replacement gilt will be in the herd and the initial gilt cost, plus recurring expenses and income, are accounted for, as well as the cull value of the sow.
Tax issues. It is difficult to model tax implications because of differences, for example, in state tax laws and financial status of individual producers. Because of these differences, income tax implications have been ignored in this study. However, capital gains tax rules may play an important role in sow culling and replacement decisions,18 depending on an individual's overall income situation.
NPV. As is the case with many capital budgeting decisions, discounted cash flows (NPV) provide a tool to economically evaluate replacement gilt decisions. Net Present Value analysis is the process of taking a current investment, projecting the future net income (cash flows) from that investment, and discounting these future earnings to present-day value(s) (discounts).19 Data needed to determine NPV includes the initial investment amount, net cash flows (expressed on a yearly basis), investment salvage value, length of the planning horizon, and interest rate (discount rate). Given the assumed data, the investment with the highest NPV will be most profitable.
Spreadsheet tool. The production, financial, and market information described were analyzed using a spreadsheet template20 to derive the information needed for the NPV analysis. Development expenses (eg, feed, housing, labor) were added to the gilts' total purchase cost. Because not all gilts that are retained or purchased farrow a litter, the development costs of these unproductive gilts must be allocated among the productive gilts in the breeding herd. This is accomplished by assigning all income and expenses from the culled replacement gilts to those remaining in the breeding herd.
Expected productivity. The expected productivity (pigs born alive) of replacement gilts was based on the 5-year average PigCHAMP production values. The reported number born alive (10.1) and average parity (3.26) of sows that have farrowed (rounded to the nearest whole number) were used as base values. National Swine Improvement Federation6 parity adjustments were applied to the base values when deriving the number of live pigs that a replacement gilt would produce each parity.
Conversion of expenses to a litter basis. Fixed and variable expenses were converted to a litter basis for analysis purposes (Table 1). The interest rate was divided by litters per sow per year to estimate an interest rate per parity or time period. Principle and interest payments on debt (a fixed expense) were used in this analysis because they are an out-of-pocket expense that producers can quantify. These payments represent the economic costs of depreciation and interest associated with debt-financed capital. The use of equity capital also is an annual expense, but these are non-cash expenses that are not included in the discounted cash flow analysis used in this model. Annual principle and interest payments were calculated on the basis of initial investment less 50% equity. Loan payments were amortized using the assumed interest rate. Variable expenses included utilities, drugs and veterinary expense, breeding, labor, utilities, and insurance.
Total feed costs were estimated per litter by multiplying the price per kg of each diet by the amount consumed in each phase of production (Table 2). Total costs per litter were calculated by summing the fixed costs (principle and interest payments) and variable costs (eg, feed, veterinary and drugs, breeding, waste handling, labor, utilities, insurance) per litter (Table 1).
Conversion of revenue to a litter basis. Total revenue per litter was calculated by multiplying the number of standard pigs sold [(pigs born alive - pre-weaning mortalities) - 1% substandard pigs] per litter by the SEW pig price. For the purposes of this study, substandard pigs (eg, light weight, blemish, swollen joint, hernia) were assumed to be of no value. Net income per litter was calculated by subtracting total costs per litter from total revenue per litter.
Calculation of NPV by parity. On the basis of the average values and assumed information, the NPV was calculated by parity of the breeding female using the following generalized equation:19
![]()
In the equation, R= Replacement gilt purchase price; P1, P2, ... PN = the net income per litter for each parity; N = the number of parities the gilt remains in the breeding herd; VN = the gilt's cull value after N parities; and i = the interest rate or discount rate per parity. A further explanation which outlines the complexity of calculating net income, is discussed by Barry19 and others.
Sensitivity analyses. To evaluate the effects of various production and expense factors on the parity in which a replacement gilt reaches a positive NPV, sensitivity analysis was conducted for number of pigs born alive per litter, SEW pig price, and replacement gilt costs.
Determination of pigs sold. Income per parity was based upon the number of SEW pigs sold. The number of pigs born alive and the average parity of sows that farrowed1-5 were used to adjust the base number of pigs born alive per litter (average 10.1 born alive from a 3.26 average parity of sows that farrowed) by the parity in which the pigs are produced according to NSIF6 number born alive parity adjustments. After parity adjustments were made, the number of pigs sold per litter was calculated by subtracting the mortality that occurs from birth through weaning from the parity-adjusted number born alive value and subtracting 1% of pigs assumed to be substandard.
Results and discussion
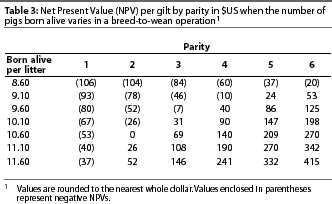
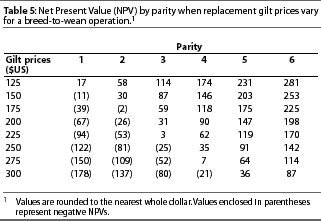
Given the assumptions outlined in Tables 1 and 2, a sow reaches a positive NPV at parity three in the model breed-to-wean operationused in this analysis. Review of Tables 3, 4, and 5 as related to the original production and price values in this analysis (10.1 pigs born alive, $200 replacement gilt cost, $32 SEW pig price) reveals that the estimated NPVs of gilts are identical, as they should be. The values in the tables are the estimated NPVs for the given parity and production measurement under consideration. For instance, in Table 3, a gilt with an average number born alive of 9.10, remaining in the herd through three parities, has a negative NPV of $46. This gilt must remain in the herd for more than four parities to break even.
Record-keeping services have reported that parity of culled sows in all participating commercial swine herds averaged 3.36 in 1996-2000, and the parity of culled sows in the top 10% of herds surveyed averaged 4.85.1- 5 On the basis of this analysis, the average sow in an average breed-to-wean commercial swine operation just reaches a positive NPV before she is culled. This indicates that considerable profit potential is never attained because the sow does not remain in the breeding herd in later parities. Parities three through six are generally considered the peak producing parities6 and the time when lifetime production has the potential to exceed that needed to pay for the producer's investment in a replacement gilt (Table 3). Replacements culled after the first or second parity are unprofitable investments for the majority of the production and price levels analyzed.
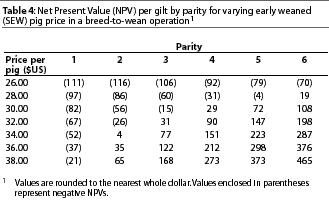
NPV sensitivity analyses. Results of sensitivity analyses demonstrating the relative change in NPV per parity due to changes in number of pigs born alive, SEW pig price, or replacement gilt prices are presented in Tables 3, 4, and 5, respectively. Factors affecting the parity at which a positive NPV is attained include income, number of pigs born alive (affects the number of pigs sold per litter, Table 3) and the SEW pig price (Table 4). Two of these factors have substantial effects on producers. When production or SEW pig price changes, so does the parity at which a positive NPV is attained.
NPV sensitivity to number born alive. The herd average number of pigs born alive would have to decline 0.5 pigs per litter (5% deviation from assumed value) to change the parity in which a positive NPV is attained from parity three to parity four in the example operation. In contrast, the number of pigs born alive would have to increase by four pigs per litter to reduce the parity at which a positive NPV is attained from parity three to parity two if all other assumptions are held constant (Table 3).
NPV sensitivity to SEW pig price. If SEW pig price declines $2 from $32 per head, while the base price and all other assumptions remain constant, the parity at which a positive NPV is attained increases to parity four from the original parity three (Table 4). The $2 price decline is a decrease of 6.25%. Similarly, if SEW pig price improves by the same $2 margin, the parity in which a positive NPV is attained is reduced to parity two (Table 4). These results show that relatively small changes in market price may have a considerable impact on the profitability of investing in a replacement female. Some early weaned pig production contracts provide discounts (eg, for weight, blemishes) and incentives (eg, for pigs per sow per year, sow mortality). These may substantially alter yearly producer returns and change the parity at which a positive NPV is attained.
NPV sensitivity to replacement gilt price. Replacement gilt price ($150 to $275 evaluated in this study) has relatively less influence on the length of service a gilt must provide to reach a positive NPV (Table 5) in a breed-to-wean operation when compared to number born alive and SEW pig price. Gilt replacement price must increase $50 (a 25% increase from the assumed $200 cost) to change the parity at which a positive NPV is attained from parity three to parity four. In contrast, if all other factors remain constant, gilt price would need to be reduced by 12.5% ($25 decrease) from the original $200 to reduce the parity at which a positive NPV is attained from parity three to parity two.
NPV sensitivity comparisons. This analysis indicates that NPV is less sensitive to changes in gilt replacement purchase price when compared to average herd number born alive and SEW pig price. A greater percentage change in gilt replacement price is needed to change the parity in which a positive NPV is attained. Additionally, breed-to-wean producers who can reduce their genetics costs and hold other costs constant can improve their operation profitability by reducing the parity at which a positive NPV is attained.
Equity position impact on NPV. Differences in equity position for breed-to-wean operations may also affect the parity at which a positive NPV is attained, although to a lesser degree compared to number born alive and SEW pig price. Holding other assumptions constant, operation equity must decline from 50% to 30% to raise the parity at which a positive NPV is attained from parity three to parity four. Conversely, increasing equity from 50% to 75% reduces the parity at which a positive NPV is attained from parity three to parity two. The amount of fixed cost that is attributable to a single breeding herd female is relatively small when considering the number of breeding females that will pass through the operation during the lifetime of the facility, thus explaining the relatively small impact of one gilt on the sensitivity of NPV to varying levels of debt and equity.
Producer use of NPV analyses. Using current production levels, SEW pig price, production costs, and equity information, individual producers may use NPV analyses to evaluate their herds. If sows are not remaining in the breeding herd for a sufficient length of time to reach a positive NPV, producers must determine the cause of early removal of sows and take corrective action. Many of the causes of sow culling, and possible solutions, have been identified in previous studies.21-27
An NPV analysis may be used to economically evaluate different genetic lines or sources of replacement gilts whose price and performance differ. The NPV and associated sensitivity analyses may also be used by producers to be more informed when negotiating with replacement gilt suppliers. Paying more for gilts that have longer productive lives may be more profitable than purchasing inferior, lower quality gilts that are culled after their first or second parities.
Implications
- In this economic model, a replacement gilt must remain in the breeding herd for three parities before reaching a positive NPV.
- The current economic model indicates that sows having a longer productive herd life, when SEW price is at profitable levels, are more profitable investments than females which remain in the herd for shorter periods of time.
- Producers should identify factors which can improve productive life in order to improve the NPV of their replacement gilts.
- Increasing SEW pig prices and productivity can improve the parity in which a replacement gilt reaches a positive NPV.
References - refereed
6. National Swine Improvement Federation. Guidelines for uniform swine improvement programs. Washington, DC: United States Department of Agriculture Program Aid 1157; 1996.
7. Muirhead MR, Alexander TJL. Managing pig health and the treatment of disease. 1st ed. Sheffield, United Kingdom: 5M Enterprises Ltd; 1999:134.
18. Smith VH. Agricultural asset replacement and tax structure changes. South J Agric Econ. 1990:112-121.
19. Barry PJ, Ellinger PN, Hopkin JA, Baker CB. Financial management in agriculture. 5th ed. Danville, Illinois: Interstate Publisher; 1995:275.
21. Brake JHA te. Culling of sows and the profitability of piglet production. Neth J Agric Sci. 1986:427-435.
24. Friendship RM, Wilson MR, Almond GW, McMillan I, Hacker RR, Pieper R, Swaminathan SS. Sow wastage: Reasons for and effect on productivity. J Vet Res. 1996:205-208.
26. Tholen E, Bunter K, Hermesch S, Graser H-U. The genetic foundation of fitness and reproduction traits in Australian pig populations. 1. Genetic parameters for weaning to conception interval, farrowing interval and stayability. Aust J Agric Res. 1996;47:1261-1274.
27. Xue JL, Dial GD, Marsh WE, Lucia T. Association between lactation length and sow reproductive performance and longevity. JAVMA. 1997;210:935-938.
References - non refereed
1. Koketsu Y, ed. PigCHAMP DataSHARE, 1998 Summary Report. St Paul, Minnesota: University of Minnesota; 1999.
2. Koketsu Y, ed. PigCHAMP DataSHARE, 1999 Summary Report. St Paul, Minnesota: University of Minnesota; 2000.
3. Koketsu Y, ed. PigCHAMP DataSHARE, 2000 Summary Report. St Paul, Minnesota: University of Minnesota; 2001.
4. PigCHAMP DataSHARE, 1995 Summary Report. St Paul, Minnesota: University of Minnesota; 1996.
5. PigCHAMP DataSHARE, 1996 Summary Report. St Paul, Minnesota: University of Minnesota; 1997.
8. Campbell J, Stalder K, Cross T. Economic analysis of 600-sow unit contract SEW feeder pig production unit. Knoxville, Tennessee: University of Tennessee; 1999. The University of Tennessee Extension Agricultural Economics and Resource Development Report 6.
9. Federal Reserve Bank of Minneapolis. 2002. Quarterly survey of agricultural credit conditions. Available at: http://www. agebb.missouri.edu/mgt/mgtnews/0008/rates/interestrates.htm. Accessed December 7, 2002.
10. Hurt C. Livestock Pricing Outlook. 1999. Available at: http://www.farmdoc.uiuc.edu/marketing/livestockoutlook/0401hog_text.html. Accessed December 7, 2002.
11. National Pork Board. Pork Facts 2001/2002. Available at: http://www.porkboard.org/docs/pkfacts2001.pdf. Accessed December 7, 2002.
12. Baas TJ. 1999 ISU Swine Business Record Program. [2000 Swine Research Report]. Available at: http://www.extension.iastate.edu/ipic/reports/00swinereports/asl-670.pdf. Accessed December 7, 2002.
13. Baas TJ. 1999. 1998 ISU Swine Business Record Program. [1999 Swine Research Report]. Available at: http://www.extension.iastate.edu/ipic/reports/99swinereports/asl-1674.pdf. Accessed December 7, 2002.
14. Baas TJ. 1997 ISU Swine Business Record Program. [1998 Swine Research Report]. Available at: http://www.extension.iastate.edu/Pages/ansci/swinereports/asl-1579.pdf. Accessed December 7, 2002.
15. Baas TJ. 1996 ISU Swine Business Record Program. [1997 Swine Research Report]. Available at: http://www.extension.iastate.edu/Pages/ansci/swinereports/asl-1502.pdf. Accessed December 7, 2002.
16. United States Department of Agriculture National Agricultural Statistics Service. Agricultural Statistics 2001. Available at: http://www.usda.gov/nass/pubs/agr01/01_ch1.pdf. Accessed December 7, 2002.
17. The Kansas Swine Nutrition Guide. Manhattan, Kansas: Kansas State University; 1997. Kansas State University Agricultural Experiment Station and Cooperative Extension Service Publication S-99.
20. Lacy C, Stalder K, Cross T, Conatser G. Breeding herd replacement female evaluator. Available at: http://www.agriculture.utk.edu/ansci/docs/GILTSEWVer2001.xls. Accessed December 7, 2002.
22. Brisbane JR, Chesnais JP. Relationship between backfat and sow longevity in Canadian Yorkshire and Landrace pigs. In: Who's Who in Canadian Swine. Ottawa, Ontario: Canadian Swine Breeders Assoc; 1997:20-21.
23. Dial G, Koketsu Y. Reproductive failure. Understanding the reasons that sows are culled for infertility. In: Deen J, ed. Int Pigletter. Owatonna, Minnesota: Pig World; 1996:15-16.
25. Rozeboom DW. Gilt pool management to maximize longevity and lifetime performance. Proc AD Leman Swine Conf. St Paul, Minnesota. September 1996:34-38.
