What's your interpretation? |
Non refereed |
Enamored of McNemar's: Vaccination compliance monitoring
Robyn Fleck, DVM
Schering-Plough Animal Health Corporation, PO Box 40, Norman, AR 71960; Tel: 870-334-3058
Cite as: Fleck R. Enamored of McNemar's: Vaccination compliance monitoring. J Swine Health Prod. 2004;12(5):270-271.
| Twenty-five pigs vaccinated at 11, 13, and 15 weeks of age with an H1N1 swine influenza virus (SIV) vaccine, and 16 unvaccinated cohorts, were tested serologically by H1N1 ELISA prevaccination and 2 weeks after the third vaccination. Is there a difference in the response between vaccinates and controls? What additional analysis of the data might uncover a response to vaccination? What might be interfering with your detection of a response to vaccination? | 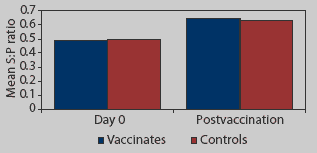 |
Young swine born to sows vaccinated for swine influenza virus (SIV) prefarrowing may have maternal antibodies lasting for up to 16 weeks. Maternal antibody levels in a pig population may vary considerably due to variation in individual sow titers and in the amount of colostrum ingested by each pig. The range of ELISA sample-to-positive (S:P) ratios for this population on the day of first vaccination was 0.08 to 1.16 (H1N1 SIV ELISA; Idexx Laboratories, Westbrook, Maine).
When maternal antibody-positive pigs are vaccinated, they may not all seroconvert;1 rather, the group's average titers may continue to decay. Pigs without detectable maternal antibodies on the day of first vaccination will seroconvert and their titers will increase.1 In commercial situations, it is likely that field virus will also be present and will induce seroconversion in some unvaccinated pigs that have no detectable maternal antibody. This makes evaluation of vaccine-induced seroconversion difficult, even when an unvaccinated control group is utilized.
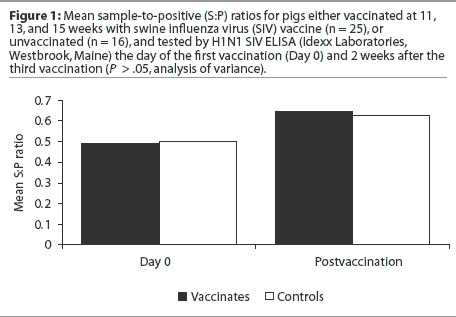
As one could easily guess from the data presented in Figure 1, no statistically significant difference was detected in the mean S:P values of the vaccinates and controls after the third vaccination (analysis of variance; P > .05). Statistical analysis was performed using SAS version 6.12 (SAS Institute, Cary, North Carolina).
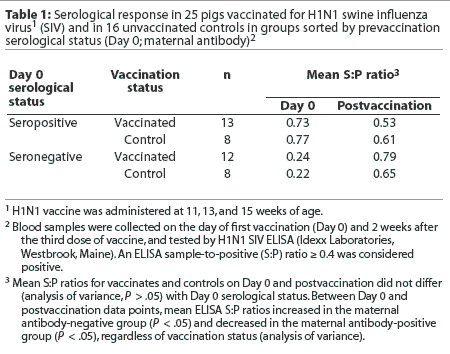
It is hypothesized that the presence of maternal antibody on the first day of vaccination may interfere with seroconversion; therefore, the pigs were sorted according to whether they were negative (S:P < 0.4) or positive (S:P >= 0.4) for maternal antibodies by SIV ELISA on the day of first vaccination (Day 0). Mean postvaccination S:P ratio was then evaluated by maternal antibody status. There was no significant difference in mean postvaccination S:P ratios between vaccinates and controls (Table 1) whether or not the pigs were maternal antibody-positive on Day 0. Mean S:P ratios increased for the maternal antibody-negative group and decreased for the maternal antibody-positive group, regardless of vaccination status (Table 1).
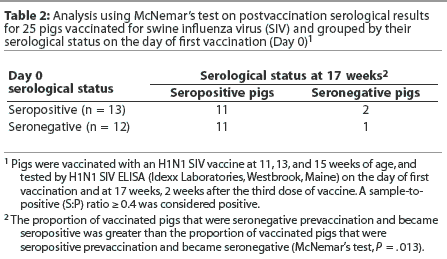
When the same animals are evaluated at different time points, as in this study, McNemar's test may be used to analyze the data. This test assumes that there are two possible outcomes (in this case, pigs are seropositive or seronegative by H1N1 ELISA). The outcomes may be compared for a randomly selected pair of animals. In this case, the pair consisted of matched individuals that were either maternal antibody-positive or maternal antibody-negative by H1N1 ELISA on Day 0. The null hypothesis is that vaccination has no effect on serocon-version rates. Table 2 shows the results of a McNemar's test on the data for the vaccinated pigs. Of the 12 animals that were maternal antibody-negative on the day of first vaccination, 11 became positive after the third vaccination, and one remained negative. In contrast, of the 13 animals that were maternal antibody-positive on the day of first vaccination, only two became negative after the third vaccination, and 11 remained positive. The percentages of animals in each group that changed designation (either positive to negative or negative to positive) are significantly different (Table 2), indicating that change in serological status is not due to chance alone. The null hypothesis can be rejected. Animals seropositive on Day 0 tended to remain seropositive after the third vaccination, and animals seronegative on Day 0 became seropositive after the third vaccination, indicating that vaccination was likely to cause pigs to seroconvert.
When a McNemar's test was used to analyze the data from the unvaccinated pigs, the change in serological classification tended to be different, but was not signifi-cantly different (Table 3). This may be due to the small sample size. The null hypothesis (ie, leaving pigs unvaccinated has no effect on seroconversion rates) cannot be rejected. Exposure to field virus might cause seroconversion in the unvaccinated pigs, and seroconversion due to exposure to live virus also cannot be ruled out in the vaccinated group.
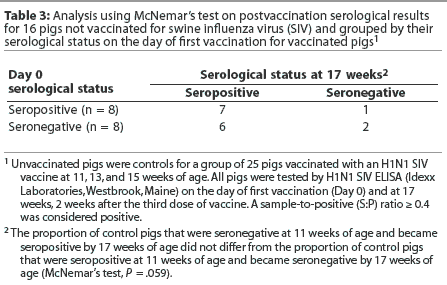
It is easy to intuitively understand a comparison between the means of a control and a treatment group. However, this may be difficult to do with a high degree of confidence if there is great deal of variation between the groups and if the sample size is small. Small sample size makes the power of this study inadequate. Tagging and measuring individual animals over a specific time period allows one to utilize the McNemar's test, which may show a response to treatment with more certainty.
Acknowledgement
I would like to extend my thanks to Diane Sweeney, PhD, for the statistical analysis and to Seaboard Farms, Inc, for sharing the data set.
Reference
*1. Wasmoen T. Keeping pace with SIV: Swine influenza virus vaccine development technologies. Proc Allen D. Leman Swine Conf. 2000:20.
*Non-refereed reference.
