What's your interpretation |
 This figure illustrates the preweaning bodyweight of
1096 pigs at 18 days of age. The mean bodyweights were 5.36 kg
(11.8 lb) for the foster group and 5.42 kg (11.9 lb) for the nonfoster
group.1 Which statistical method can you use to determine
whether there is a significant difference in bodyweight between
foster and nonfoster pigs?
T-test and paired t-test
Outcome variables are the primary factor to consider when choosing a statistical test.2 There are three types of outcome variables (see March/April 1999 "What's Your Interpretation"). The outcome variable in the cover figure is bodyweight, a continuous variable. Therefore, the t-test can be used because weight typically is normally distributed.
T-test
The t-test, which is also called "Student's t-test", was developed by William Gossett under the pseudonym "Student." The two-sample t-test can be used to compare means between two groups. The output of a t-test will include means for the two groups and a P value. In this example case, means are 5.36 kg for foster pigs and 5.42 kg for nonfoster pigs (P =.61).
When we conduct an analysis, we need to make a hypothesis, called the "null hypothesis," that the means of the two groups are not different. In our example, the null hypothesis states that there is no difference in mean bodyweight between the foster and nonfoster groups. The alternative hypothesis is that the means of the two groups actually differ.
P value
In research, experimental conclusions often depend on the P value. What does the P value tell us? The P value is a probability that you are wrong to reject the null hypothesis (i.e., wrong to believe that there actually is a difference between foster and nonfoster pigs in our example). In our case, the P value (.61) indicates that there is a 61% chance that the difference in mean bodyweights between the foster and nonfoster pigs is due to chance.
The word 'significant' is frequently used when the P value is <.05, i.e., the difference in the means between two groups is said to be 'significant' when the P value is <.05. What a P <.05 really means is that there is only a 5% chance that you are wrong if you conclude that there is a genuine difference between the two groups.
Actually, it is not always appropriate to use .05 as the significance level for all situations. The significance level should be set at P <.01, P <.1, or at other P values, depending on experiments and sample sizes. In Swine Health and Production, the word "significant" is used to indicate a P <.05 unless otherwise stated. It is also important to remember that a statistically significant difference between two measures might not be a biologically or clinically significant difference.
Paired t-test
When there is a natural pairing of the data, you need to use
paired t-test. The paired t-test is used to compare two repeated
observations on the same individuals or on matched individuals.
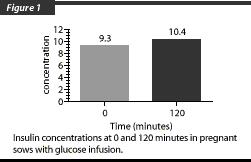
 Data in Figure 1 show insulin concentrations from 16
pregnant sows in late gestation.3 The sows received
glucose through intravenous infusion after 18 hours of feed deprivation.
Time 0 is the time immediately before glucose infusion. The hypothesis
was that insulin concentrations would return to pre-infusion
levels at 120 minutes post-infusion; i.e., that insulin concentrations
at 0 and 120 minutes would be the same.
A paired t-test should be used because blood samples were collected from the same sows at two different times. One needs to be able to calculate differences in insulin concentrations between two samples from the same animals when conducting a paired t-test, and then test the differences. The mean differences are 1.1 µIU per mL (P =.39). Therefore, one cannot reject the null hypothesis that there is no difference in insulin concentrations between 0 and 120 minutes.
References
1. Xue JL. Unpublished data. 1999.
2. Devore J, Peck R. Statistics The exploration and analysis of data. 3rd Edition, Duxbury Press; 1997
3. Xue JL, Koketsu Y, Dial GD, Pettigrew JE, Sower A, 1997. Glucose tolerance, luteinizing hormone release, and reproductive performance of first-litter sows fed two levels of energy during gestation. J Anim Sci. 75:1845-1852
